Attribution Models Demystified: Which One Fits E-Commerce vs SaaS
Attribution models determine how you credit marketing touchpoints for a conversion. Pick the wrong attribution model and you’ll either overfund noisy channels or starve the ones that set deals up. For a hands-on guide to moving beyond last-click, see our piece on multi-channel attribution. Below is a practical guide that contrasts how attribution models work for e-commerce versus SaaS, explains the main options, and shows when to use which—plus how to sanity-check the results.
Why attribution models behave differently for e-commerce vs SaaS
E-commerce
- Short(er) path to purchase; many low-ticket decisions.
- Heavy retargeting and promotions; lots of last-click activity.
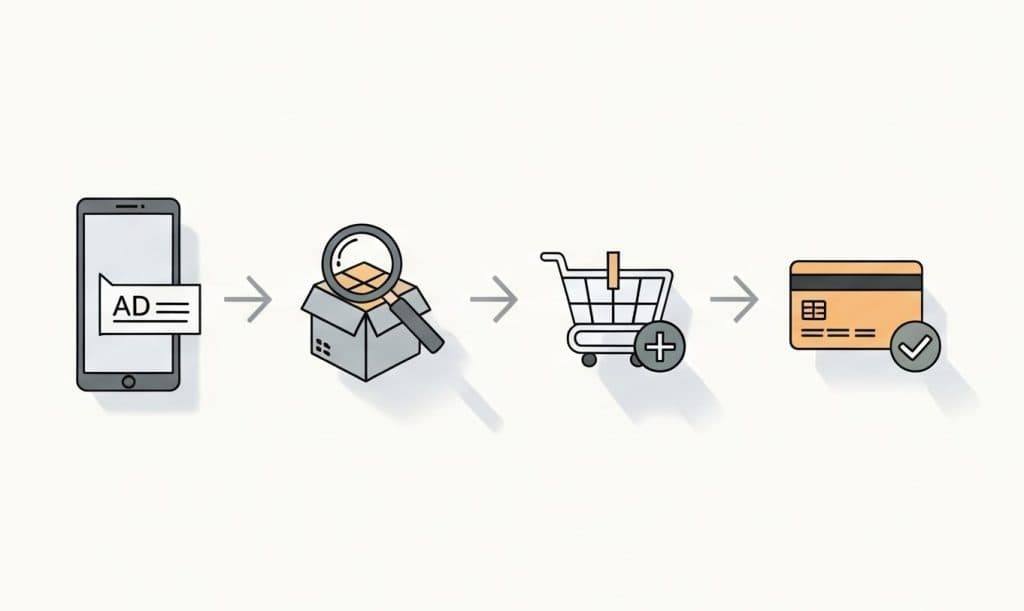
- Conversions are online and immediate (add-to-cart → checkout).
- North-star: ROAS, MER, contribution margin per order.
SaaS
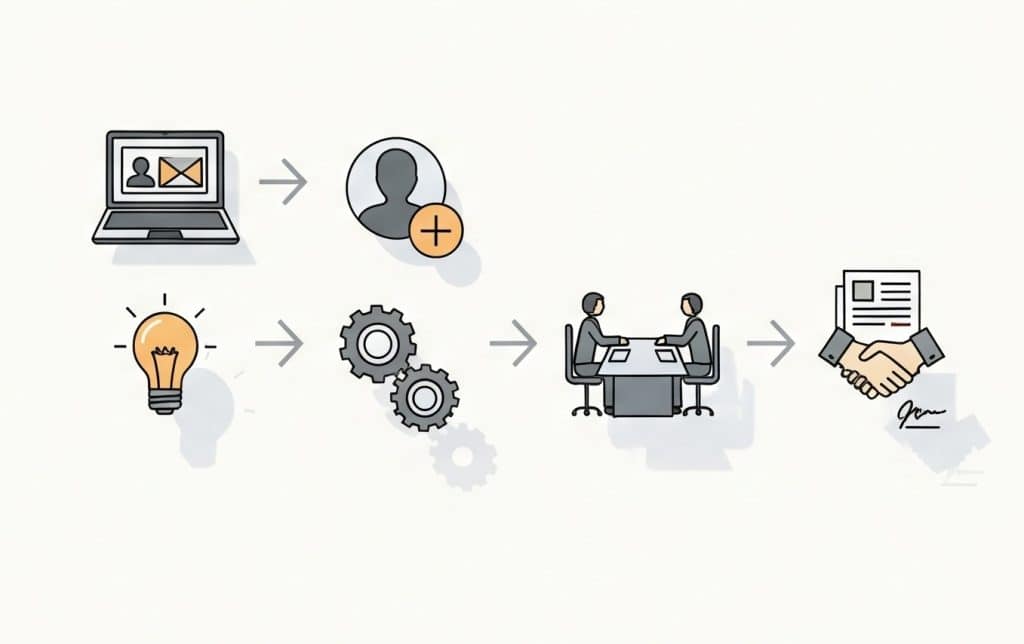
- Long, multi-stakeholder journeys (ad → content → signup → PQL → demo → contract).
- Multiple funnel goals (signup, activation, opportunity, closed-won).
- Offline touches (SDR emails/calls, events) matter.
- North-star: CAC payback, LTV:CAC, pipeline velocity.
The attribution models toolbox (rule-based to experimental)
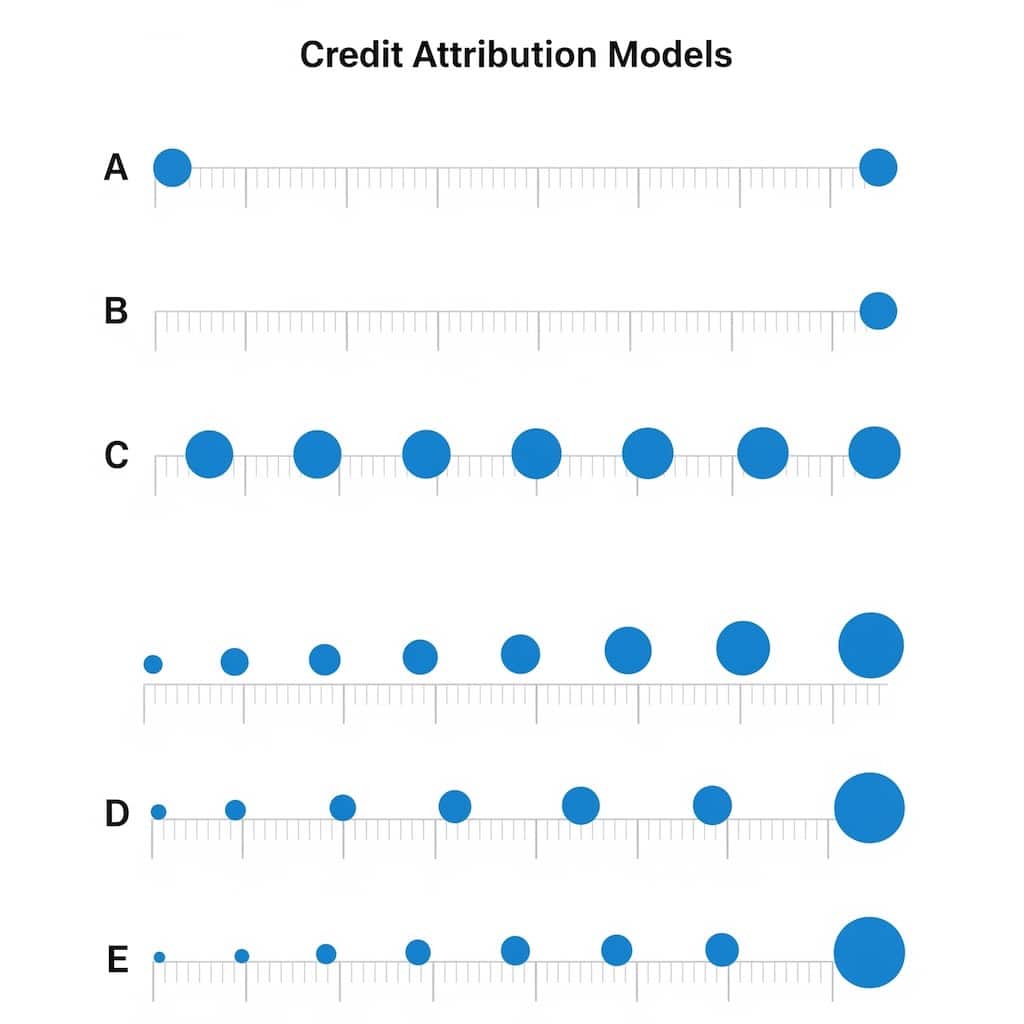
Single-touch attribution models
- Last click: 100% credit to final touch.
- First click: 100% credit to first touch.
Multi-touch attribution models (rule-based)
- Linear: equal credit to all touches.
- Time decay: more credit as touches get closer to conversion.
- Position-based (U-shaped): heavier on first & last; some for the middle.
- W-shaped / Z-shaped: adds weight to opportunity-creating touches (e.g., first touch, lead creation, opportunity).
Data-driven attribution models (algorithmic MTA)
- Learns marginal contribution of each touchpoint from your data.
Beyond click-paths
- Incrementality tests (geo-lift, PSA tests, holdouts): measure lift rather than credit.
- MMM (Marketing Mix Modeling): statistical model using spend & outcomes over time; great for channel-level budget setting.
Pro tip: Use attribution models like MTA for tactics and MMM/incrementality for budgets. Triangulate—don’t bet the farm on one lens.
Attribution models: quick recommendations by business type
If you’re E-commerce
Early stage / sparse data
- Use Last non-direct click as a sanity baseline for paid search & shopping.
- Layer Time decay to reduce over-crediting low-funnel retargeting when there’s more than one touch.
Scaling / multi-channel
- Adopt Position-based (U-shaped) for most prospecting → retargeting paths.
- Keep Last click alongside it for reporting continuity; compare ROAS deltas.
- Add Data-driven once you have volume (tens of thousands of conversions) across channels.
Promotion-heavy or catalog-wide campaigns
- Run geo-holdouts — a form of A/B testing with statistical significance — on paid social & display to capture view-through impact without over-attributing.
- Pair with a lightweight MMM to set split between search, social, affiliates.
What to watch
- Contribution margin per order (post-promo, post-shipping).
- New vs returning customer mix (attribution should not push you into discounting your base too hard).
If you’re SaaS
Top-funnel + PLG motion
- Use W-shaped (first touch, lead creation, opportunity) to reward content & community that create pipeline, not just signups.
- Track multiple conversions: Signup → Activation (PQL) → SQL → Closed-won.
Sales-assisted / Enterprise
- Combine W- or Z-shaped with manual touches from CRM (SDR sequences, events).
- Implement Data-driven once events are properly stamped (UTMs, email touches, meetings).
- Validate with incrementality (e.g., turn off LinkedIn in select regions for 4 weeks).
What to watch
- LTV:CAC and payback by channel & segment.
- Pipeline source vs influence: a channel can influence deals without sourcing them—don’t cut it blindly.
Choosing between attribution models: a practical decision matrix
| Situation | E-commerce pick | SaaS pick |
|---|---|---|
| Few touches, fast checkout | Last non-direct click → Time decay | Position-based if content assists; else First click for demand gen visibility |
| Many touches across weeks | U-shaped or Data-driven + promo holdouts | W-/Z-shaped or Data-driven + SDR/CRM events |
| Heavy brand spend | MMM + geo-lift for brand; MTA for lower-funnel | MMM/geo-lift for brand & events; MTA for mid/low funnel |
| Need board-level budget split | MMM (quarterly) | MMM (quarterly) |
| Need channel/creative optimization | MTA (rule-based → data-driven) | MTA (W-shaped → data-driven) |
Implementation checklist (works for both)
- Define conversion chain
E-com: View content → Add to cart → Purchase (tracking micro conversions along the way).
SaaS: Visit → Signup → Activation → MQL/SQL → Opportunity → Closed-won. - Event hygiene
- Standardize UTMs; enrich with campaign, creative, audience.
- Stamp offline touches (CRM campaign members, calls, meetings, events).
- Identity resolution
- Stitch by user_id, email (hashed), and device cookies where legal.
- Capture first-party identifiers at signup/checkout.
- Pick a baseline and an experiment
- Baseline: rule-based model everyone can see.
- Experiment: data-driven or holdout to calibrate.
- Governance & reviews
- Re-evaluate weights quarterly.
- Freeze models during big promos or pricing changes to avoid noisy flips.
Common attribution models pitfalls (and fixes)
- Over-crediting retargeting
Symptom: Amazing ROAS, flat new buyer growth.
Fix: Add Time decay or cap frequency; segment new vs returning. - Ignoring post-signup stages in SaaS
Symptom: Channels look great at signup, poor at revenue.
Fix: Attribute to opportunity and revenue, not just signups; use W-shaped. - View-through bias
Symptom: Display/social look heroic.
Fix: Use geo-lift or PSA tests; limit view-through windows. - Model hopping
Symptom: Weekly changes to attribution models, confused teams.
Fix: Publish a measurement charter: which model for what decision, and when it’s reviewed.
Mini case studies
E-commerce apparel brand (mid-market)
Switched attribution models from Last click to U-shaped. Prospecting on TikTok looked “bad” on last click but “good” on U-shaped. A 10% budget shift from retargeting to prospecting increased new customers +18% at similar MER. Geo-holdouts confirmed +7–10% incremental sales in treated regions.
SaaS workflow tool (ACV ~$25k)
Implemented W-shaped with CRM touches. Content syndication was under-credited on last click but drove +22% more opportunities than reported. LinkedIn audiences looked inflated until a 6-week geo test showed +9% incremental pipeline; budgets were kept, but creatives were pruned.
How to report attribution models so people trust them
- Always show two views: your baseline (e.g., Last click) and your chosen model (e.g., W-shaped). Explain the gap.
- Tie to business outcomes: CAC payback (SaaS) and contribution margin (e-com).
- Summarize with 3 bullets and a budget recommendation, not just a chart.
Key takeaways
- E-commerce: Start with Last non-direct → upgrade to U-shaped or Data-driven; validate with geo-holdouts and watch contribution margin.
- SaaS: Favor W-/Z-shaped (multi-stage) and integrate CRM touches; validate with incrementality and optimize to revenue, not signups.
- Everyone: Use MTA for optimization, MMM/incrementality for budgets, and revisit your attribution models quarterly.
Starter templates
Attribution charter (one-pager)
- Decisions covered: budgeting, channel pruning, creative testing
- Models used: MMM for budgets, W-shaped for SaaS / U-shaped for e-com
- Review cadence: Quarterly
- Source of truth for revenue: CRM/ERP
- Change log: link
UTM standard
utm_source,utm_medium,utm_campaign,utm_content(creative id),utm_term(keyword/audience)- Enforce via link builders and CI checks in ad ops.