A/B Testing Statistical Significance: What 95% Confidence Really Means
If you’ve ever watched an A/B test tick past “95% confidence” and felt a rush to ship the winner—pause. That number doesn’t mean “there’s a 95% chance Variant B is truly better.” It’s more nuanced. Understanding what 95% confidence — a concept that directly affects how you evaluate attribution models — (and its partner, the p-value) actually means will save you from false wins, blown roadmaps, and confused stakeholders.
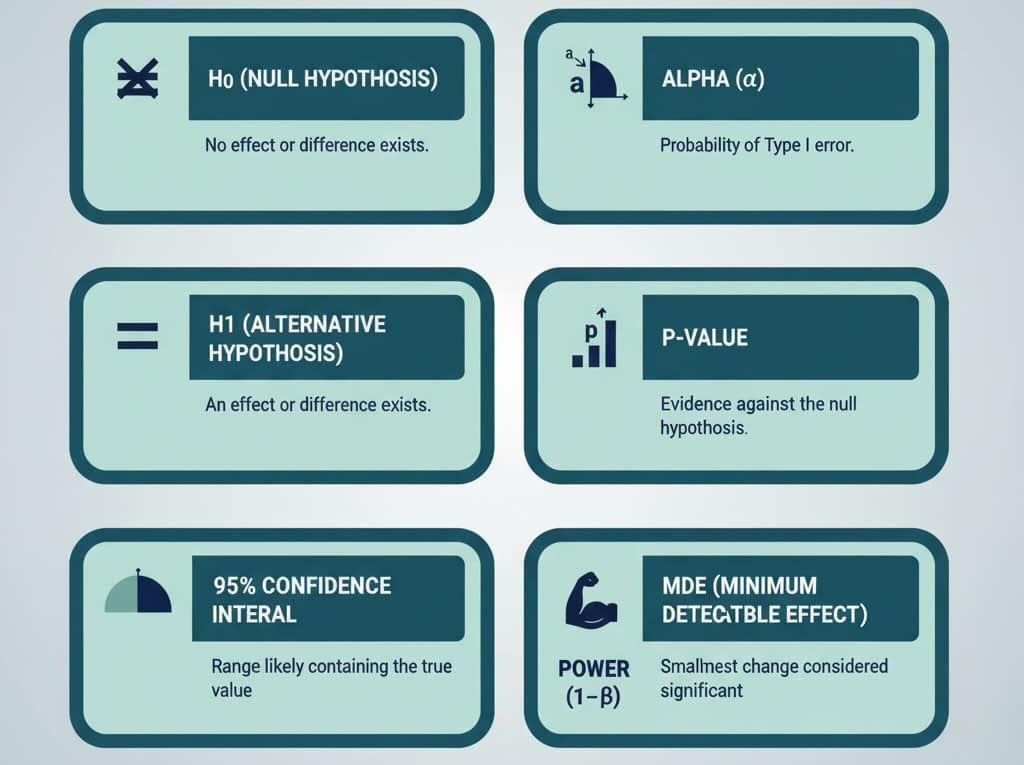
Quick vocabulary
- Null hypothesis (H₀): “There’s no real difference between variants.”
- Alternative hypothesis (H₁): “There is a real difference.”
- α (alpha): Your tolerance for false alarms—commonly 0.05 (5%).
- p-value: How surprising your data would be if H₀ were true. If p ≤ α, you call it “statistically significant.”
- 95% confidence interval (CI): A range of plausible values for the true lift. If you reran the same well-designed test forever, about 95% of those intervals would contain the true effect.
- Power (1−β): Your chance to detect a real effect when it exists (commonly 80%).
- MDE (minimum detectable effect): The smallest lift worth detecting (e.g., +0.5 percentage points in conversion).
Key correction: 95% confidence does not mean “95% chance the variant is better.” It means that under the testing procedure you chose, you’ll falsely declare a win about 5% of the time when there’s no real effect.
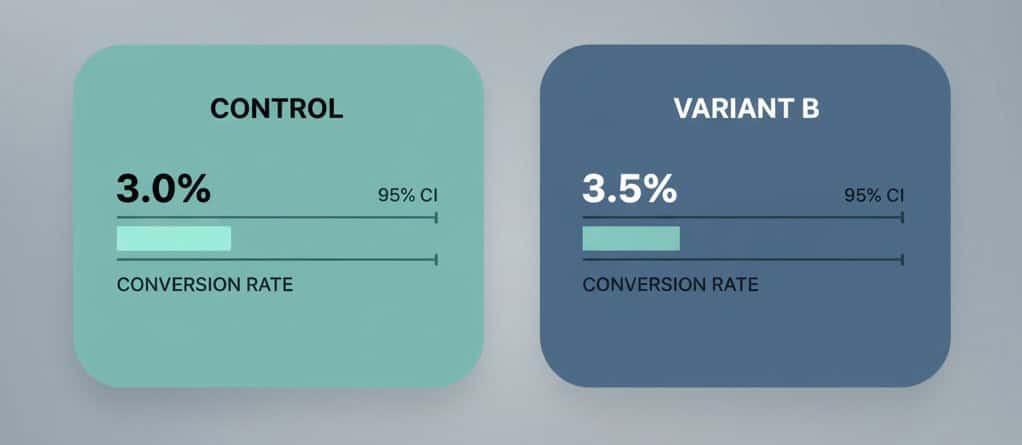
A concrete example
Say your control converts at 3.0% (300 conversions out of 10,000 visitors). Variant B converts at 3.5% (350/10,000).
- A standard two-proportion test gives p ≈ 0.046 → significant at 0.05.
- The 95% CI for the absolute lift is roughly +0.01 to +0.99 percentage points (0.0001 to 0.0099).
- Interpretation: the true lift is likely small, perhaps near +0.5 pp, and could be barely above zero. It’s a win statistically, but the business impact may be modest.
Flip the numbers slightly (3.0% vs 3.4%) and you’ll get p ≈ 0.11—not significant. Same traffic, slightly smaller lift, very different conclusion. That sensitivity is why planning matters.
Statistical vs. practical significance
A result can be statistically significant and still not worth shipping.
- Statistical: Did you beat the noise? (p ≤ 0.05)
- Practical: Is the lift meaningful after cost, complexity, and risk?
Back-of-the-envelope:
If your site gets 500k sessions/month, AOV is $60, and baseline conversion is 3.0%, an absolute lift of +0.5 pp adds ~2,500 orders/month (500,000 × (0.035−0.03)) → ~$150k incremental revenue/month before margin. That’s practical. If your traffic is 1/10th of that, the same lift may not move the needle.
How much traffic do you need?
Traffic requirements explode as you chase smaller lifts. For a baseline of 3.0% and an MDE of +0.5 pp (to 3.5%), with 95% confidence and 80% power, you need roughly ~19,700 visitors per variant. If your MDE is +0.3 pp, the sample size jumps dramatically. Set an MDE tied to business value, not vanity lifts.
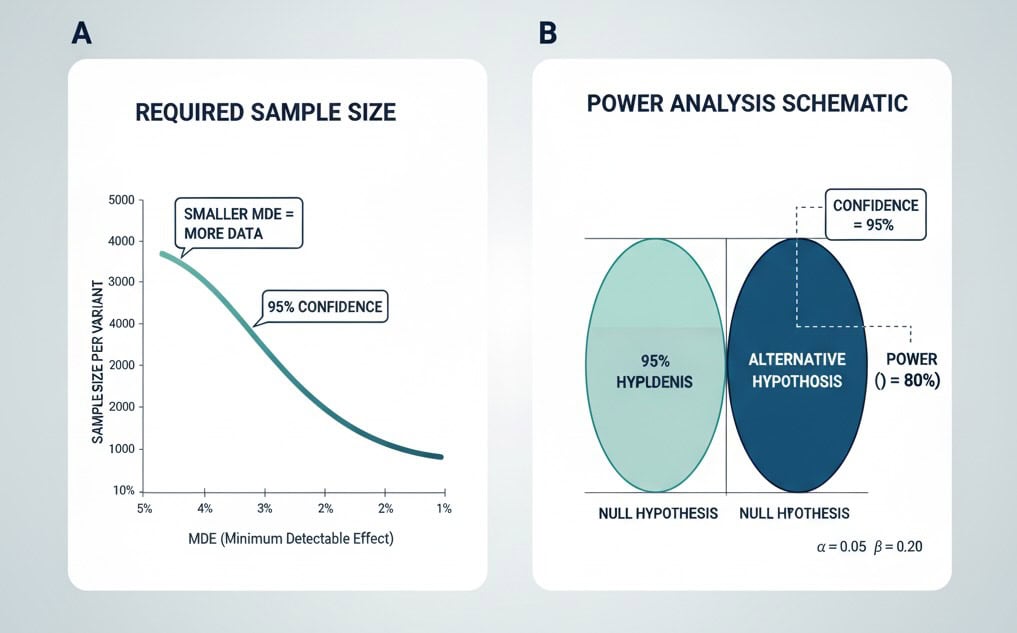
Rule of thumb: Decide MDE and primary KPI before launching the test. Then compute sample size and run time realistically (including seasonality and day-of-week effects).
The “peeking” trap (and how to avoid it)
Stopping when you first see p < 0.05 inflates false positives. Common fixes:
- Fixed-horizon testing: Precommit to a sample size or end date and don’t peek.
- Sequential methods: Use tests that adjust for repeated looks (e.g., group-sequential, alpha spending, or always-valid inference).
- Bayesian approaches: Monitor the probability your variant is better under a prior; still predefine your stopping rule.
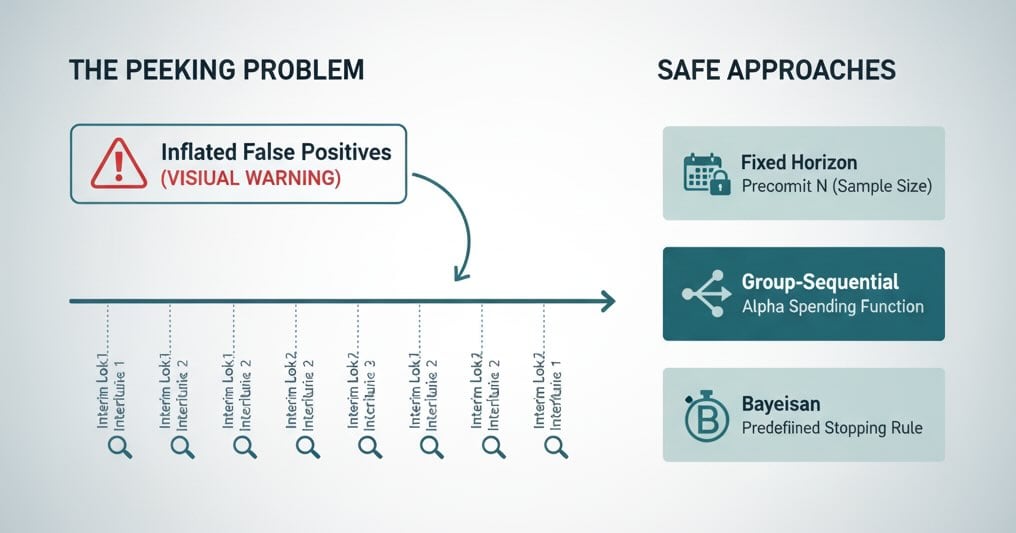
Pick one approach and document it in your experimentation playbook.
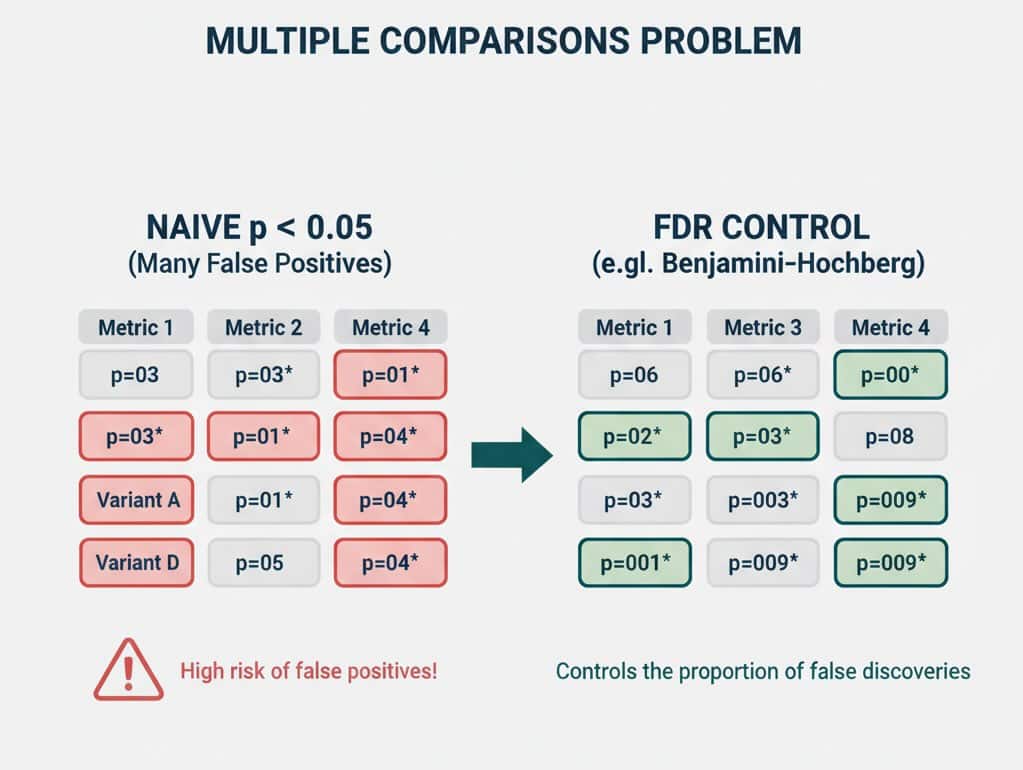
Multiple comparisons: many variants, many metrics
Testing A/B/C/D, or tracking 10 KPIs per test, increases the chance of a false win somewhere.
- Pre-register a primary metric (e.g., checkout conversion).
- Use guardrail metrics (e.g., refund rate, latency) only for safety checks.
- If you must compare many variants, consider false discovery rate (FDR) control (e.g., Benjamini–Hochberg) rather than naive p < 0.05 everywhere.
Beware “winner’s curse”
The biggest observed lift in a set of tests often overstates the true effect. Expect some regression toward the mean. Two practical mitigations:
- “Ship & verify”: After rolling out, keep a lightweight holdout or run an A/A-like shadow to confirm impact.
- Shrink small wins in forecasts (e.g., discount by 25–50% if CI barely clears zero).
Confidence intervals beat single p-values
When presenting results, lead with the effect size and its CI, not just pass/fail.
- “Variant B lifted conversion by +0.5 pp (95% CI: +0.0 to +1.0 pp), p=0.046. Expected incremental revenue $X–$Y/month given current traffic/AOV.”
Stakeholders can then weigh upside vs. uncertainty.
Good test hygiene checklist
- One primary metric and one MDE agreed up front.
- Power analysis completed; sample size and run length documented.
- Traffic quality stable (bots filtered, major campaigns noted).
- No mid-test scope creep (don’t change targeting or design mid-stream).
- Seasonality control (run across full weeks; avoid holidays unless intentional).
- Peeking policy explicit (fixed horizon or sequential).
- Post-ship verification or rolling holdout for meaningful wins.
FAQ you’ll be asked (answers you can use)
Is 95% confidence the same as a 95% chance the variant is better?
No. It means your test procedure would yield a false win ≤5% of the time when there’s truly no effect.
The CI crosses zero—what now?
Your data are consistent with no effect. Either the lift is too small to detect with your sample, or there’s truly no difference. Increase sample size, revisit MDE, or rethink the change.
Should I always use 95%?
Not necessarily. For low-risk UX polish, 90% may be fine to move faster. For high-impact pricing or checkout changes, consider 99%. Higher confidence → more traffic/time.
My test is “not significant,” so it failed… right?
Not necessarily. You learned the effect (if any) is smaller than your MDE. That’s valuable—stop chasing marginal ideas and focus on bigger bets. Consider starting with micro conversions to identify where those bigger bets live.
The takeaway
“95% confidence” is a risk setting, not a verdict of certainty. Treat it as one input alongside effect size, confidence intervals, run quality, and business impact. When you plan MDE up front, power your tests properly, avoid peeking, and present results with intervals—not just a green light—you’ll ship changes that win in the spreadsheet and in the P&L. Meanwhile, make sure you’re reading your exit pages correctly to understand where users drop off before and after your experiments.