Facebook Page Insights: What Numbers to Watch
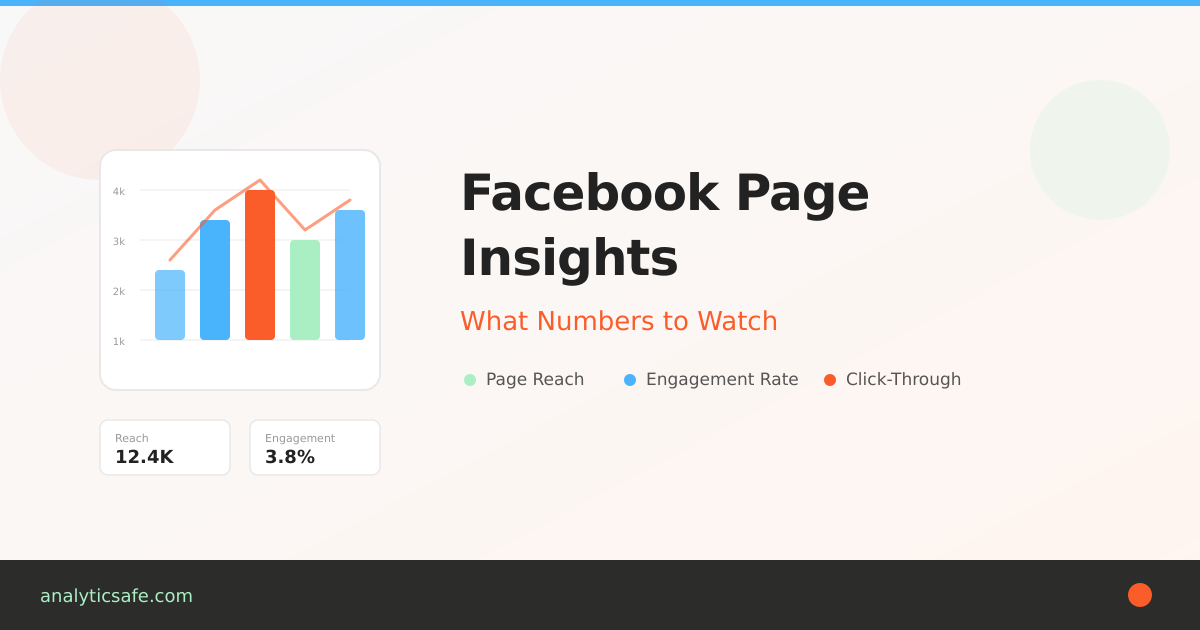
If you run a small business page, “more likes” is not a strategy. The point of Facebook Page Insights is to show whether your posts reach the right people, spark action, and contribute to sales. Below is a practical, plain-English guide to the few numbers that deserve your attention—and how to read them.
Start with a one-page scorecard
Before diving into the metrics, set up a simple monthly scorecard. Keep it to two parts:
Health (top of funnel)
- Reach
- New followers
- Content mix (posts, Reels, Stories)
Impact (middle/bottom)
- Engagement rate
- Link clicks (or button taps)
- Message inquiries / leads
Trends matter more than single-day spikes. Compare week over week and month over month.
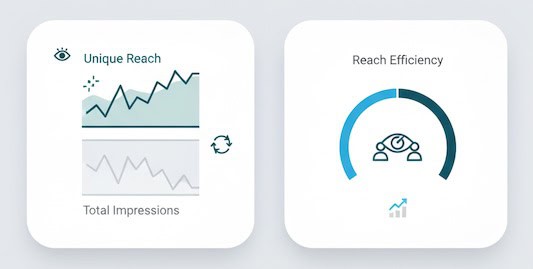
Reach vs. Impressions: how many people you actually touched
- Reach = the number of unique people who saw any of your content (posts, Reels, Stories, Lives, ads if applicable).
- Impressions = total views; one person can generate multiple impressions.
How to read it
- Rising reach with flat followers usually means the algorithm likes your recent content (good!).
- Flat reach with growing followers suggests your content isn’t earning distribution—time to adjust formats, hooks, or timing.
Quick formula
Reach Efficiency = Reach ÷ Followers. Track it monthly to see if your content is punching above (or below) your audience size.
Followers: growth that actually sticks
- New Followers (Net) = follows minus unfollows.
- Where Follows Happened (post, profile, search, invite) shows what attracted them.
How to read it
- Spikes tied to a single post? Replicate the format and topic.
- Unfollows after promotions? Calibrate frequency and targeting—people may like your product, not constant pitches.
Engagement Rate: the quality filter
Engagement tells you whether your content resonated enough to earn interaction.
- Reactions, Comments, Shares, Saves (for Reels) are the high-value actions.
- Link Clicks show intent to learn or buy.
- Engagement Rate (by reach) =
(Reactions + Comments + Shares + Saves + Clicks) ÷ Reach.
How to read it
- Don’t chase raw likes. Comments and shares drive distribution and often correlate with intent. In fact, these engagement signals are the same behavioral factors that matter for SEO.
- Track ER by content type (posts vs. Reels vs. Stories). If Reels deliver 2–3× the ER, shift your mix.
Content diagnostics: what, exactly, worked
Post-level metrics to sort by:
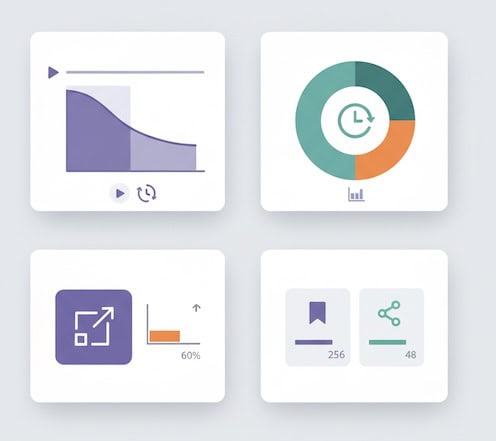
- 3-second Plays & ThruPlays (video/Reels) – did the hook stop the scroll?
- Average Watch Time – stories that kept attention.
- Link Click-Through Rate (CTR) =
Link Clicks ÷ Reach– usefulness of your call-to-action. - Saves – intent to revisit (great signal for evergreen or how-to content).
- Shares – earned new audiences for free.
How to read it
- High 3-sec plays but low watch time? Your hook works, story doesn’t—front-load value.
- High saves but low clicks? Turn the save into a micro-lead magnet (e.g., “comment ‘GUIDE’ to get the PDF”).
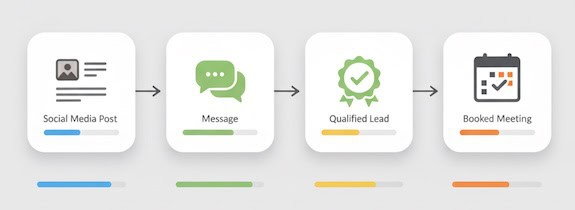
Messaging & leads: when interest becomes a conversation
If you rely on DMs or WhatsApp:
- New Conversations – count and trend.
- Response Rate & Median Response Time – speed matters for conversion.
- Conversation Outcomes – tags like “booked,” “pricing,” “support” (create a simple spreadsheet if needed).
How to read it
Fast replies increase close rates. If many chats start from a specific post format (e.g., before-and-after), you’ve found a lead driver.
Negative signals: the quiet red flags
- Hides, Unfollows, Report as Spam—watch rate, not absolute numbers.
- Hide Rate =
Hides ÷ Reach. - Unfollow Rate =
Unfollows ÷ Followers.
How to read it
Small businesses often ignore these. Rising negatives usually mean content frequency is too high, targeting is off, or creative feels click-baity.
Audience insights: who you’re actually reaching
- Age, Gender, Location – compare to your buyer profile.
- Active Times – when your audience is most likely to be online.
How to read it
If your top cities don’t match your service area, use geo cues in your creative (landmarks, local slang) and refine boosts to local audiences.
Reels & video: the distribution engine
Facebook heavily distributes short video. Focus on:
- Hook retention (first 3 seconds watched).
- Average watch time and percentage watched.
- Replays (strong interest).
- Shares (organic reach multiplier).
How to read it
If average watch time is <30% of the video, shorten it or move the payoff earlier. Use comments as prompts (“Want the checklist? Comment ‘CHECKLIST’”) to convert attention into responses.
Clicks to website: closing the loop
You can’t manage what you can’t attribute. Use UTM parameters on links and buttons (if you’re unsure what counts as direct traffic and why it’s often wrong, read that first) (e.g., “Shop Now,” “Book”). Track in your analytics:
- Sessions & Bounce Rate from Facebook
- Conversion Rate by campaign/content
- Revenue or Leads attributed to Facebook traffic
How to read it
A post can have modest engagement but strong click-through and sales. Judge posts by their job — much like judging exit pages by user intent—awareness, engagement, or conversion—not a single vanity metric.
Paid boosts (if you use them): keep it simple
For boosted posts or ads, watch:
- Cost per ThruPlay (video), Cost per Click, Cost per Lead/Purchase
- Frequency (ad fatigue if >3–4 in short campaigns)
- Quality Ranking / Conversion Ranking (creative resonance)
How to read it
Great organic posts make great boosts. If costs rise and frequency climbs, refresh creative or audience.
Cadence: how often should a small business post?
- Quality over quota. Two strong posts or Reels per week can outperform daily mediocre content.
- Consistency wins. Pick a schedule you can sustain for 90 days and evaluate with trends, not day-to-day swings.
- Mix: 40% value (tips/how-tos), 30% social proof (testimonials, UGC), 20% product, 10% behind-the-scenes/humor.
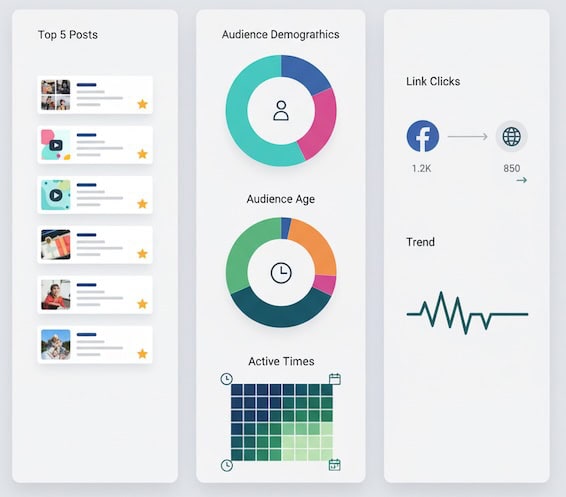
A minimal monthly review ritual
- Top 5 posts by outcome
- Awareness winner (highest reach per follower)
- Engagement winner (highest ER by reach)
- Clicks/lead winner (highest CTR or leads)
- One surprise (performed better than expected)
- One flop (what to stop doing)
- Audience & timing check
- Any shifts in top locations / active times?
- Pipeline sanity check
- DMs/leads from Facebook vs. last month
- Website traffic and conversions from Facebook (UTM)
- Decisions
- What you’ll do more of, fix, and drop next month.
Document in one slide. Share with anyone who helps create content.
Common pitfalls to avoid
- Overweighting vanity metrics. 100 shares beat 1,000 passive likes.
- Changing too many variables at once. Test format, hook, and CTA separately.
- Ignoring creative “first frames.” The opening visual and first line determine reach on short video.
- Posting at your convenience, not your audience’s. Use Insights’ active times.
- No call-to-action. Even awareness posts should suggest a next step (save, share, comment a keyword, visit).
The takeaway
You don’t need every chart in Facebook Page Insights. Track reach to know you’re being seen, engagement rate to confirm your content resonates, clicks/messages to prove impact, and a couple of negative signals to keep quality high. Review trends monthly, double down on formats your audience loves, and judge each post by the job it’s meant to do. That’s SMM your business can bank on.