Category: Attribution

  • Multi-Channel Attribution: Solving the Last-Click Attribution Problem

    Multi-Channel Attribution: Solving the Last-Click Attribution Problem

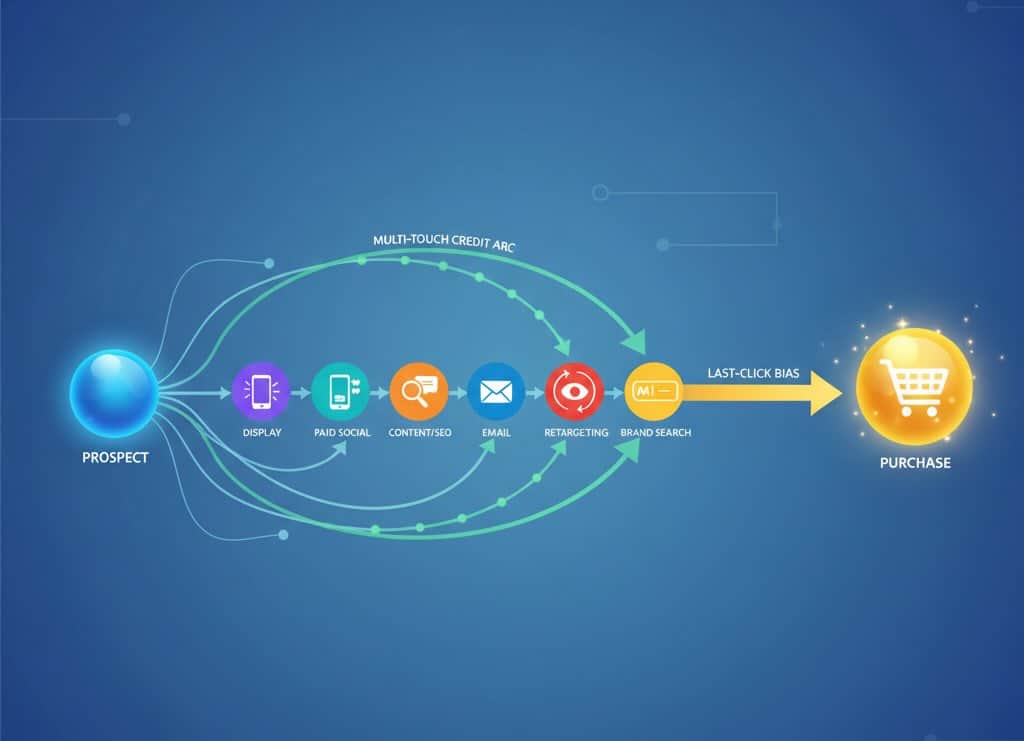
    Last-click is simple—and simply wrong for modern funnels. It credits the final touch (often brand search or direct) and under-values upper- and mid-funnel work that actually created demand. If you’re allocating budget on last-click alone, you’re almost certainly over-investing in harvest channels and starving the ones that plant and nurture. Here’s a pragmatic playbook to move beyond last-click and fund channels according to their real contribution.

    Why last-click fails (and what “good” looks like)

    Symptoms of last-click bias

    • Brand search looks like a superhuman performer.
    • Prospecting display/social appear unprofitable.
    • Retargeting is over-funded because it harvests demand created elsewhere.
    • Content/SEO gets under-credited for first-touch and mid-funnel assists.

    A better goal
    Attribute value across all meaningful touches, estimate incremental impact, and use those insights to reallocate spend toward the highest marginal return.

    The attribution toolbox (rule-based, algorithmic, experimental)

    Three-column attribution toolbox: rule-based, algorithmic, and experimental methods

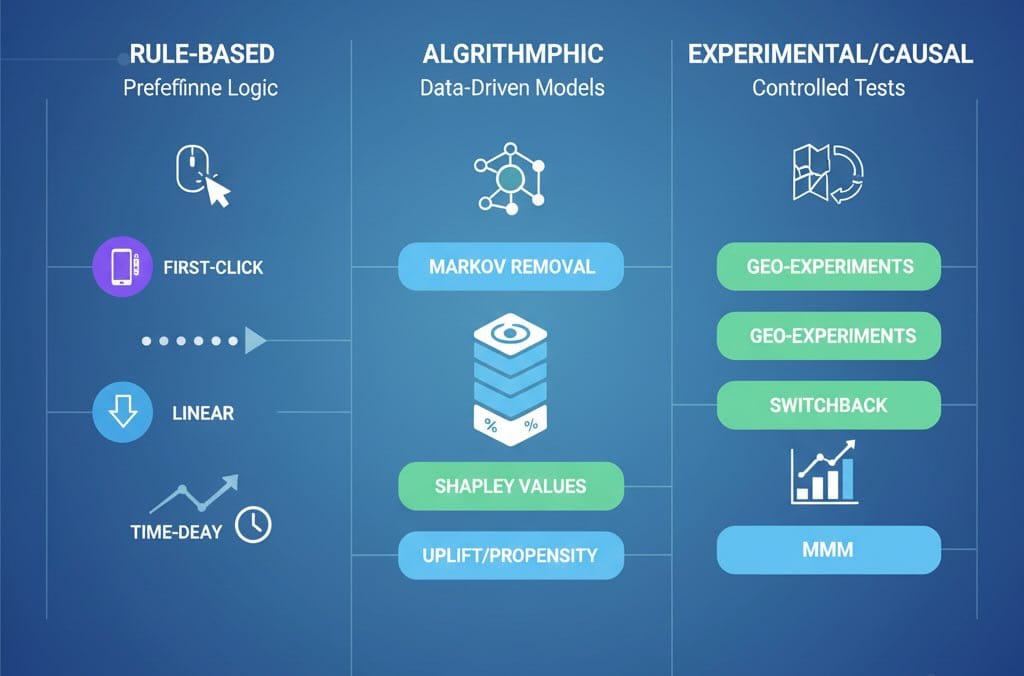
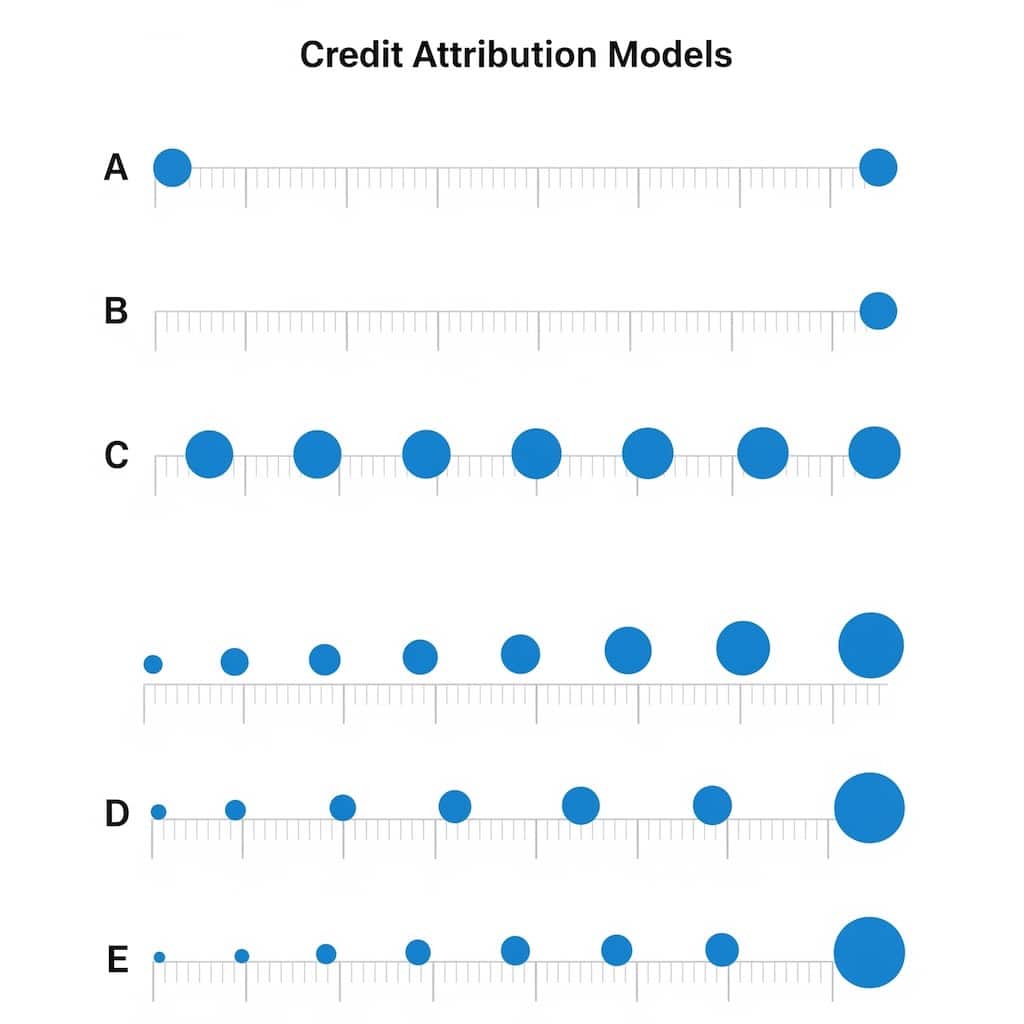
    1) Rule-based models (fast, directional)

    ModelWhen it helpsWatch-outs
    First-clickValue discovery/awarenessOver-credits prospecting; ignore conversion closers
    LinearSimple “team sport” viewTreats all touches as equal (they’re not)
    Time-decayLong cycles where recency mattersStill arbitrary weights
    Position-based (U-shape/W-shape)Credit intro + nurture + closePre-set weights; tune by journey length

    Use case: Establish a baseline and sanity-check extremes (“Are we over-funding retargeting?”). Rule-based is easy to deploy in GA4/BI and useful as an operator view, not the exec truth.

    2) Algorithmic models (data-driven, diagnostic)

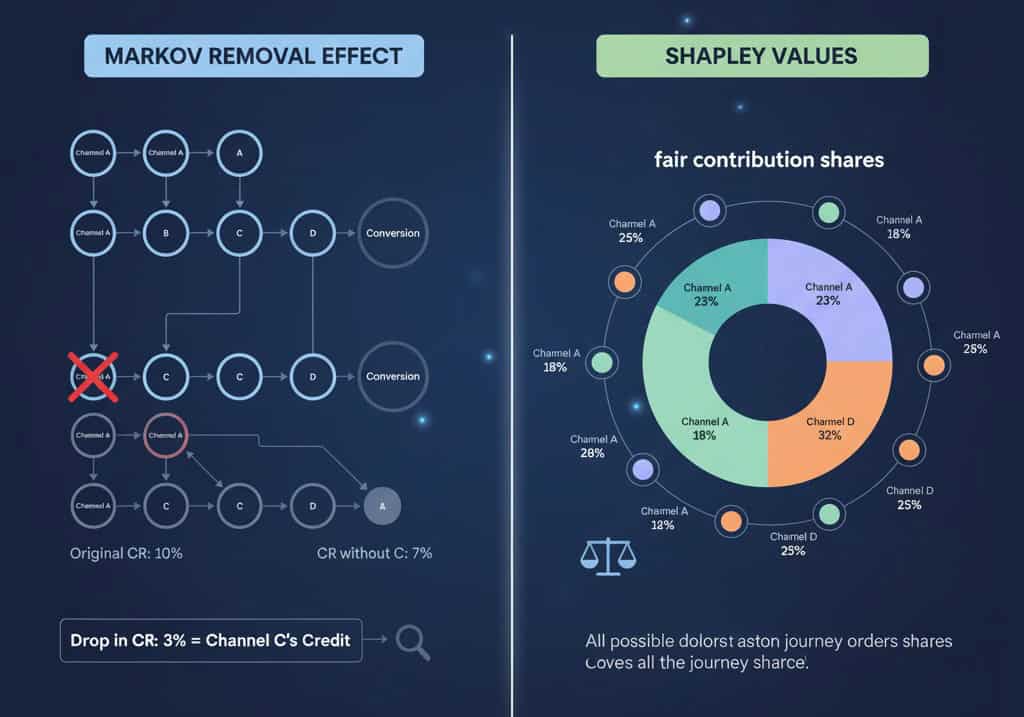
    • Markov chains (removal effect): Simulate journeys; remove a channel and measure conversion rate drop. Great to surface true assist value (e.g., upper-funnel display that “opens” paths).
    • Shapley values: Game-theory credit based on all channel permutations. Fair but computationally heavier.
    • Uplift/propensity models: Predict the incremental probability of converting because of exposure. Powerful in walled gardens or for targeting strategy.
    Markov removal effect and Shapley value credit side by side.

    Use case: Diagnose which channels (and sequences) create value vs. ride along. Requires clean path data, consistent channel taxonomy, and enough volume.

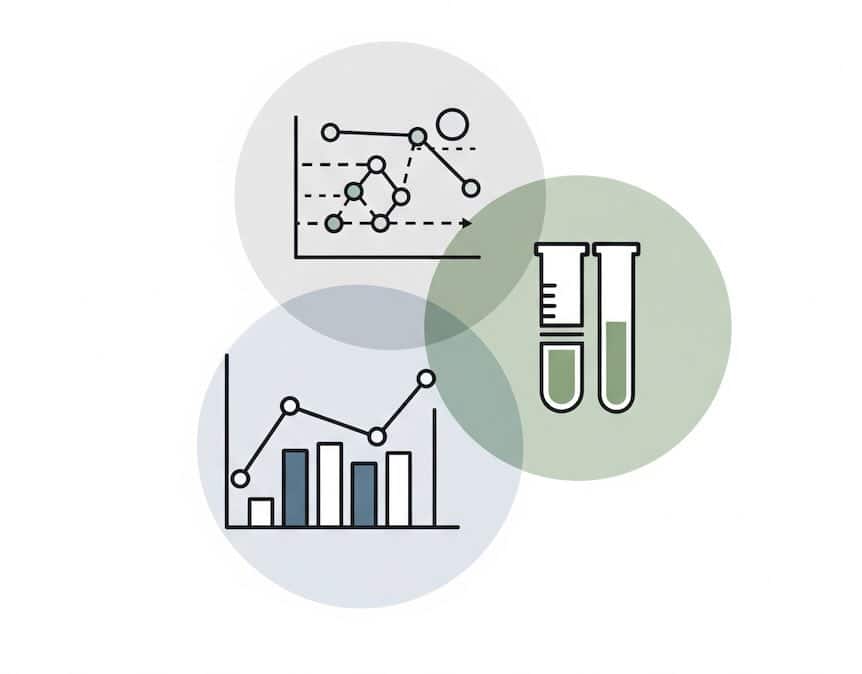
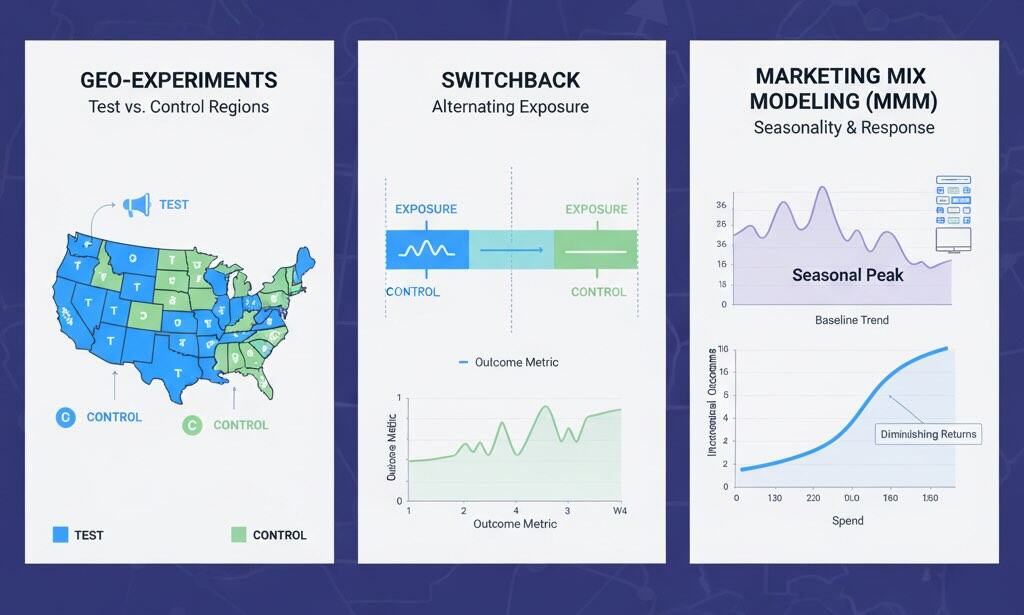
    3) Experimental & causal reads (gold standard for budget)

    • Geo-experiments / PSA holdouts: Turn spend up/down in test geos; compare to controls.
    • Staggered rollouts / switchback tests: Alternate exposure by time or audience.
    • MMM (Media Mix Modeling): Top-down, long-horizon model for incremental contribution by channel with seasonality and price effects.
    Geo-lift, switchback timeline, and MMM response curve for causal attribution.

    Use case: Set budget at the portfolio level and validate model-based attribution. Ideally, run at least one causal read per quarter.

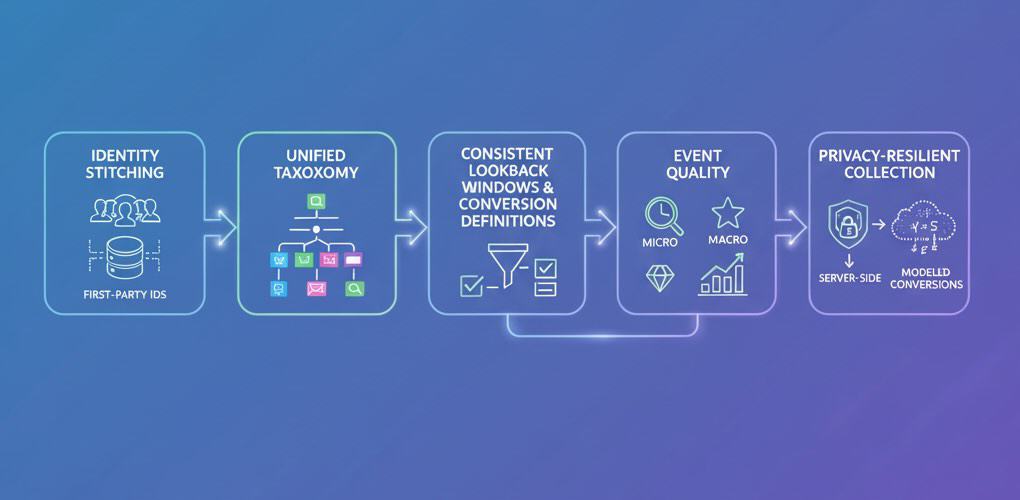
    Data foundations that make or break MTA

    1. Identity stitching:
      Use a hierarchy: user_id (logged-in) → first-party identifiers (hashed email/phone) → device + modeled links. Respect privacy and consent (CMP, opt-out flows).
    2. Unified channel taxonomy:
      Normalize source/medium/campaign and dedupe platforms’ self-reported conversions (especially post-view).
    3. Consistent windows & conversion definitions:
      Align lookback windows per channel (e.g., 7-day click for paid social, 30-day for search) and lock definitions so finance can reconcile.
    4. Event quality:
      Track micro-conversions (product view, add-to-cart, demo start) and macro-conversions (orders, SQOs, revenue). Send channel & landing metadata into CRM/orders.
    5. Privacy resilience:
      With fewer third-party cookies, lean on first-party data, modeled conversion APIs, and consented server-side tracking.
    Pipeline of MTA data foundations from identity to privacy-resilient collection

    E-commerce vs. SaaS: model choices that fit the motion

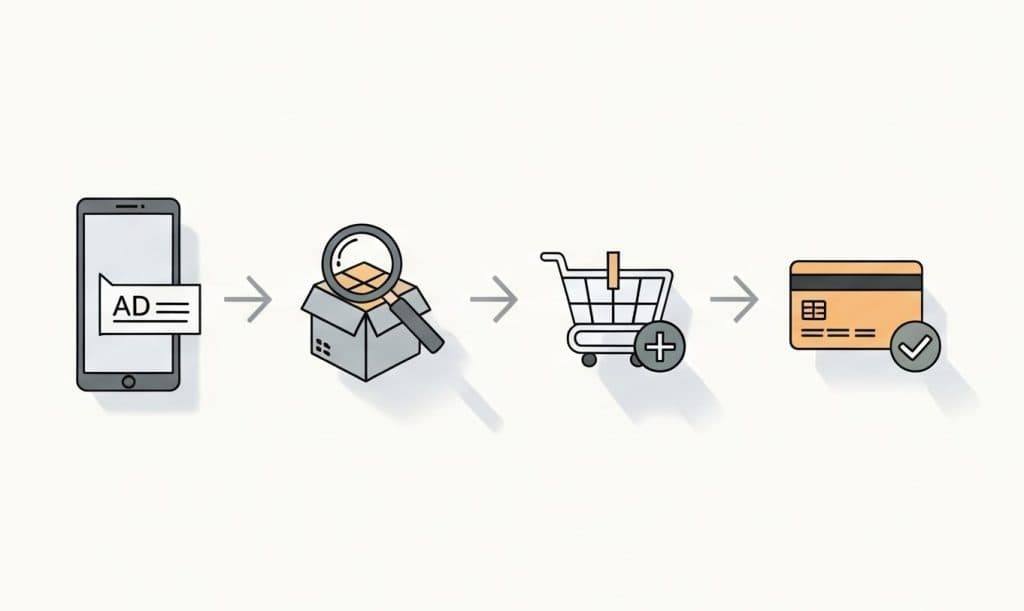
    E-commerce (many touches, short cycles, large SKU mix)

    • Primary: Markov or Position-based with SKU/margin overlays. Optimize to revenue per visit and contribution margin, not just ROAS.
    • Causal guardrail: Geo-lift when scaling new channels or creative types.
    • Tactics:
      • Separate brand vs. non-brand search.
      • Break out retargeting to prevent over-credit.
      • Attribute content/SEO assists via time-decay or Markov.

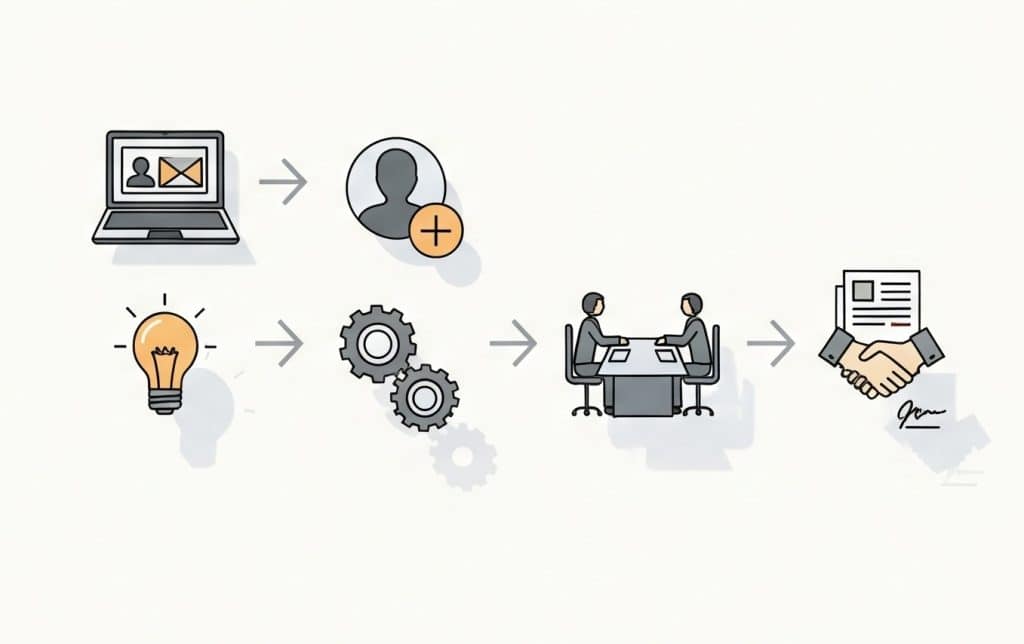
    B2B/SaaS (long cycles, offline stages, lower volume)

    • Primary: Position-based (W-shape: first touch, lead creation, opportunity) across people and accounts; add Shapley for diagnostic fairness.
    • Causal guardrail: Holdouts on paid social or ABM audiences; MMM annually for board budgets.
    • Tactics:
      • Attribute to opportunity creation and pipeline value, not just MQLs.
      • Map multi-person journeys at the account level (buyer committees).
      • Use time-decay for nurture touches over long sales cycles.

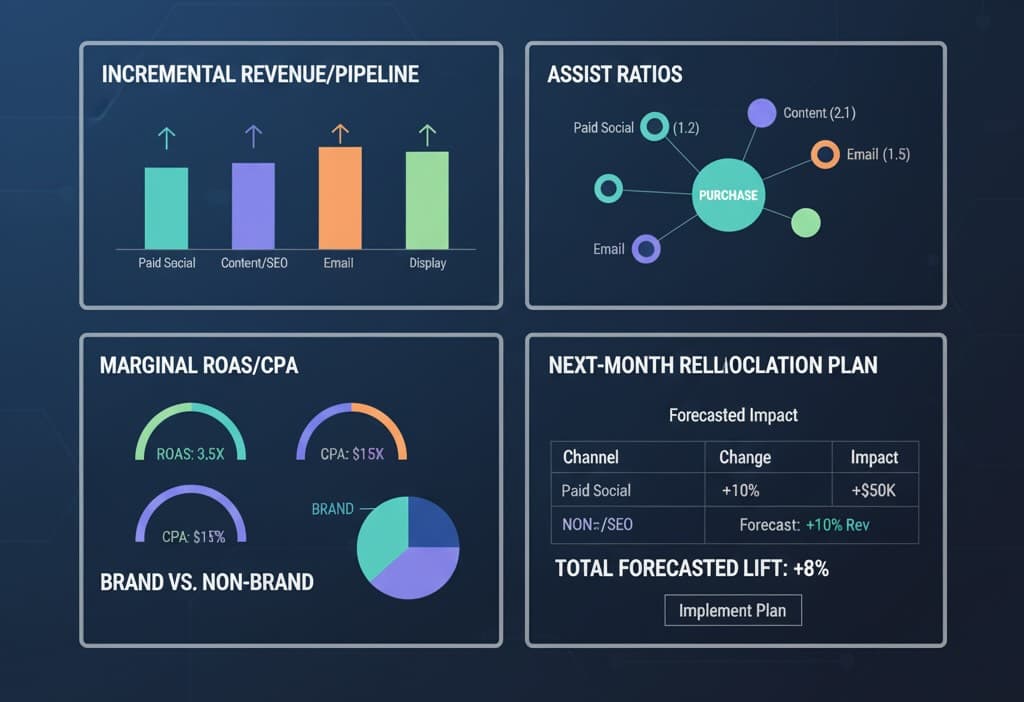
    Turning attribution into budget moves

    1. Build a scorecard execs will trust
      • Top channels by incremental revenue/pipeline and marginal ROAS/CPA
      • Assist ratios (assists:conversions) to surface under-valued channels
      • Non-brand vs. brand split
      • Next-month reallocation plan with forecasted impact
    2. Optimize to the margin, not just revenue
      • Apply product/category margins so you don’t over-fund low-margin winners.
      • Track incremental cost per incremental order/opportunity (ICPO/ICPOp).
    3. Use marginal analysis
      • For each channel, estimate the next $10k effect (from geo-tests/MMM response curves).
      • Shift spend from low-marginal-return to high-marginal-return buckets weekly.
    4. Create “funding rules”
      • If channel’s marginal ROAS > target → greenlight scale to the next cap.
      • If assist share is high but last-click is low → protect with a floor budget; judge on assisted conversions and Markov removal effect.
    Attribution-driven budget dashboard with marginal returns and assist ratios

    Common pitfalls (and how to avoid them)

    • Platform double counting:
      Use a system of record for conversions (analytics or orders/CRM). Treat platform-reported numbers as directional.
    • Attribution ≠ incrementality:
      Run periodic causal tests. Calibrate models to those results.
    • One model to rule them all:
      Keep one primary model for exec reporting and one diagnostic to guide channel owners. Consistency beats model-hopping.
    • Ignoring creative & audience granularity:
      Attribution at the channel level hides variance. Evaluate audience × creative cells for true scale pockets.
    • Privacy whiplash:
      Expect fewer deterministic links. Invest in first-party data, modeled conversions, and consent management.

    What “good” looks like (signs you’re winning)

    • Budget moves weekly based on marginal returns, not politics.
    • Prospecting and mid-funnel content get protected budgets because assist value is proven.
    • Brand search ROAS normalizes after removing misattributed credit.
    • Leadership dashboards show incremental revenue/pipeline with error bars from experiments—not just pretty charts.

    Bottom line: Last-click is a flashlight—it shows you the finish line and hides the race. Multi-channel attribution blends rule-based clarity, algorithmic nuance, and experimental truth so you can fund the touches that create demand, not just the ones that collect it. Shift budgets with confidence, and your CAC and payback will tell you you’re on the right track.

  • Attribution Models Demystified: Which One Fits E-Commerce vs SaaS

    Attribution Models Demystified: Which One Fits E-Commerce vs SaaS

    Attribution is simply how you credit marketing touchpoints for a conversion. Pick the wrong lens and you’ll either overfund noisy channels or starve the ones that set deals up. Below is a practical guide that contrasts e-commerce and SaaS, explains the main models, and shows when to use which—plus how to sanity-check the results.

    Why attribution is hard (and different) for e-commerce vs SaaS

    E-commerce

    • Short(er) path to purchase; many low-ticket decisions.
    • Heavy retargeting and promotions; lots of last-click activity.
    • Conversions are online and immediate (add-to-cart → checkout).
    • North-star: ROAS, MER, contribution margin per order.
    e-commerce customer journeys

    SaaS

    • Long, multi-stakeholder journeys (ad → content → signup → PQL → demo → contract).
    • Multiple funnel goals (signup, activation, opportunity, closed-won).
    • Offline touches (SDR emails/calls, events) matter.
    • North-star: CAC payback, LTV:CAC, pipeline velocity.
    SaaS customer journeys from ad to purchase/contract

    The attribution toolbox (rule-based to experimental)

    Single-touch

    • Last click: 100% credit to final touch.
    • First click: 100% credit to first touch.

    Multi-touch (rule-based)

    • Linear: equal credit to all touches.
    • Time decay: more credit as touches get closer to conversion.
    • Position-based (U-shaped): heavier on first & last; some for the middle.
    • W-shaped / Z-shaped: adds weight to opportunity-creating touches (e.g., first touch, lead creation, opportunity).

    Data-driven (algorithmic MTA)

    • Learns marginal contribution of each touchpoint from your data.

    Beyond click-paths

    • Incrementality tests (geo-lift, PSA tests, holdouts): measure lift rather than credit.
    • MMM (Marketing Mix Modeling): statistical model using spend & outcomes over time; great for channel-level budget setting.
    Credit atribution models

    Pro tip: Use MTA for tactics and MMM/incrementality for budgets. Triangulate—don’t bet the farm on one lens.

    Quick recommendations by business type

    If you’re E-commerce

    Early stage / sparse data

    • Use Last non-direct click as a sanity baseline for paid search & shopping.
    • Layer Time decay to reduce over-crediting low-funnel retargeting when there’s more than one touch.

    Scaling / multi-channel

    • Adopt Position-based (U-shaped) for most prospecting → retargeting paths.
    • Keep Last click alongside it for reporting continuity; compare ROAS deltas.
    • Add Data-driven once you have volume (tens of thousands of conversions) across channels.

    Promotion-heavy or catalog-wide campaigns

    • Run geo-holdouts on paid social & display to capture view-through impact without over-attributing.
    • Pair with a lightweight MMM to set split between search, social, affiliates.

    What to watch

    • Contribution margin per order (post-promo, post-shipping).
    • New vs returning customer mix (attribution should not push you into discounting your base too hard).

    If you’re SaaS

    Top-funnel + PLG motion

    • Use W-shaped (first touch, lead creation, opportunity) to reward content & community that create pipeline, not just signups.
    • Track multiple conversions: Signup → Activation (PQL) → SQL → Closed-won.

    Sales-assisted / Enterprise

    • Combine W- or Z-shaped with manual touches from CRM (SDR sequences, events).
    • Implement Data-driven once events are properly stamped (UTMs, email touches, meetings).
    • Validate with incrementality (e.g., turn off LinkedIn in select regions for 4 weeks).

    What to watch

    • LTV:CAC and payback by channel & segment.
    • Pipeline source vs influence: a channel can influence deals without sourcing them—don’t cut it blindly.

    Choosing a model: a practical decision matrix

    SituationE-commerce pickSaaS pick
    Few touches, fast checkoutLast non-direct click → Time decayPosition-based if content assists; else First click for demand gen visibility
    Many touches across weeksU-shaped or Data-driven + promo holdoutsW-/Z-shaped or Data-driven + SDR/CRM events
    Heavy brand spendMMM + geo-lift for brand; MTA for lower-funnelMMM/geo-lift for brand & events; MTA for mid/low funnel
    Need board-level budget splitMMM (quarterly)MMM (quarterly)
    Need channel/creative optimizationMTA (rule-based → data-driven)MTA (W-shaped → data-driven)
    Triangulation of measurement methods: MTA click-path, MMM chart, and experiment icon overlapping

    Implementation checklist (works for both)

    1. Define conversion chain
      E-com: View content → Add to cart → Purchase.
      SaaS: Visit → Signup → Activation → MQL/SQL → Opportunity → Closed-won.
    2. Event hygiene
      • Standardize UTMs; enrich with campaign, creative, audience.
      • Stamp offline touches (CRM campaign members, calls, meetings, events).
    3. Identity resolution
      • Stitch by user_id, email (hashed), and device cookies where legal.
      • Capture first-party identifiers at signup/checkout.
    4. Pick a baseline and an experiment
      • Baseline: rule-based model everyone can see.
      • Experiment: data-driven or holdout to calibrate.
    5. Governance & reviews
      • Re-evaluate weights quarterly.
      • Freeze models during big promos or pricing changes to avoid noisy flips.

    Common pitfalls (and fixes)

    • Over-crediting retargeting
      Symptom: Amazing ROAS, flat new buyer growth.
      Fix: Add Time decay or cap frequency; segment new vs returning.
    • Ignoring post-signup stages in SaaS
      Symptom: Channels look great at signup, poor at revenue.
      Fix: Attribute to opportunity and revenue, not just signups; use W-shaped.
    • View-through bias
      Symptom: Display/social look heroic.
      Fix: Use geo-lift or PSA tests; limit view-through windows.
    • Model hopping
      Symptom: Weekly changes, confused teams.
      Fix: Publish a measurement charter: which model for what decision, and when it’s reviewed.

    Mini case studies

    E-commerce apparel brand (mid-market)
    Switched from Last click to U-shaped. Prospecting on TikTok looked “bad” on last click but “good” on U-shaped. A 10% budget shift from retargeting to prospecting increased new customers +18% at similar MER. Geo-holdouts confirmed +7–10% incremental sales in treated regions.

    SaaS workflow tool (ACV ~$25k)
    Implemented W-shaped with CRM touches. Content syndication was under-credited on last click but drove +22% more opportunities than reported. LinkedIn audiences looked inflated until a 6-week geo test showed +9% incremental pipeline; budgets were kept, but creatives were pruned.

    How to report it so people trust it

    • Always show two views: your baseline (e.g., Last click) and your chosen model (e.g., W-shaped). Explain the gap.
    • Tie to business outcomes: CAC payback (SaaS) and contribution margin (e-com).
    • Summarize with 3 bullets and a budget recommendation, not just a chart.

    Key takeaways

    • E-commerce: Start with Last non-direct → upgrade to U-shaped or Data-driven; validate with geo-holdouts and watch contribution margin.
    • SaaS: Favor W-/Z-shaped (multi-stage) and integrate CRM touches; validate with incrementality and optimize to revenue, not signups.
    • Everyone: Use MTA for optimization, MMM/incrementality for budgets, and revisit models quarterly.

    Starter templates

    Attribution charter (one-pager)

    • Decisions covered: budgeting, channel pruning, creative testing
    • Models used: MMM for budgets, W-shaped for SaaS / U-shaped for e-com
    • Review cadence: Quarterly
    • Source of truth for revenue: CRM/ERP
    • Change log: link

    UTM standard

    • utm_source, utm_medium, utm_campaign, utm_content (creative id), utm_term (keyword/audience)
    • Enforce via link builders and CI checks in ad ops.