Funnel Analysis: Finding Where Users Actually Drop Off
Here is the thing about most funnels: they look great on a whiteboard, but they rarely match what users actually do. I have spent years building funnel reports for clients, and the number one lesson I keep learning is this — funnel analysis only works when it reflects real behavior, not ideal behavior.
Most teams build their funnel around how they want users to move through the site. However, users are unpredictable. They skip steps, they loop back, and they abandon at points you never expected. So if your funnel is built on assumptions, you are essentially measuring fiction.
In this article, I will walk you through how to do funnel analysis properly. We will cover what it actually is, how to build one that mirrors reality, where users typically drop off, and how to avoid the mistakes I see teams make over and over again. By the end, you will have a clear framework for finding — and fixing — the leaks in your conversion path.

What Is Funnel Analysis?
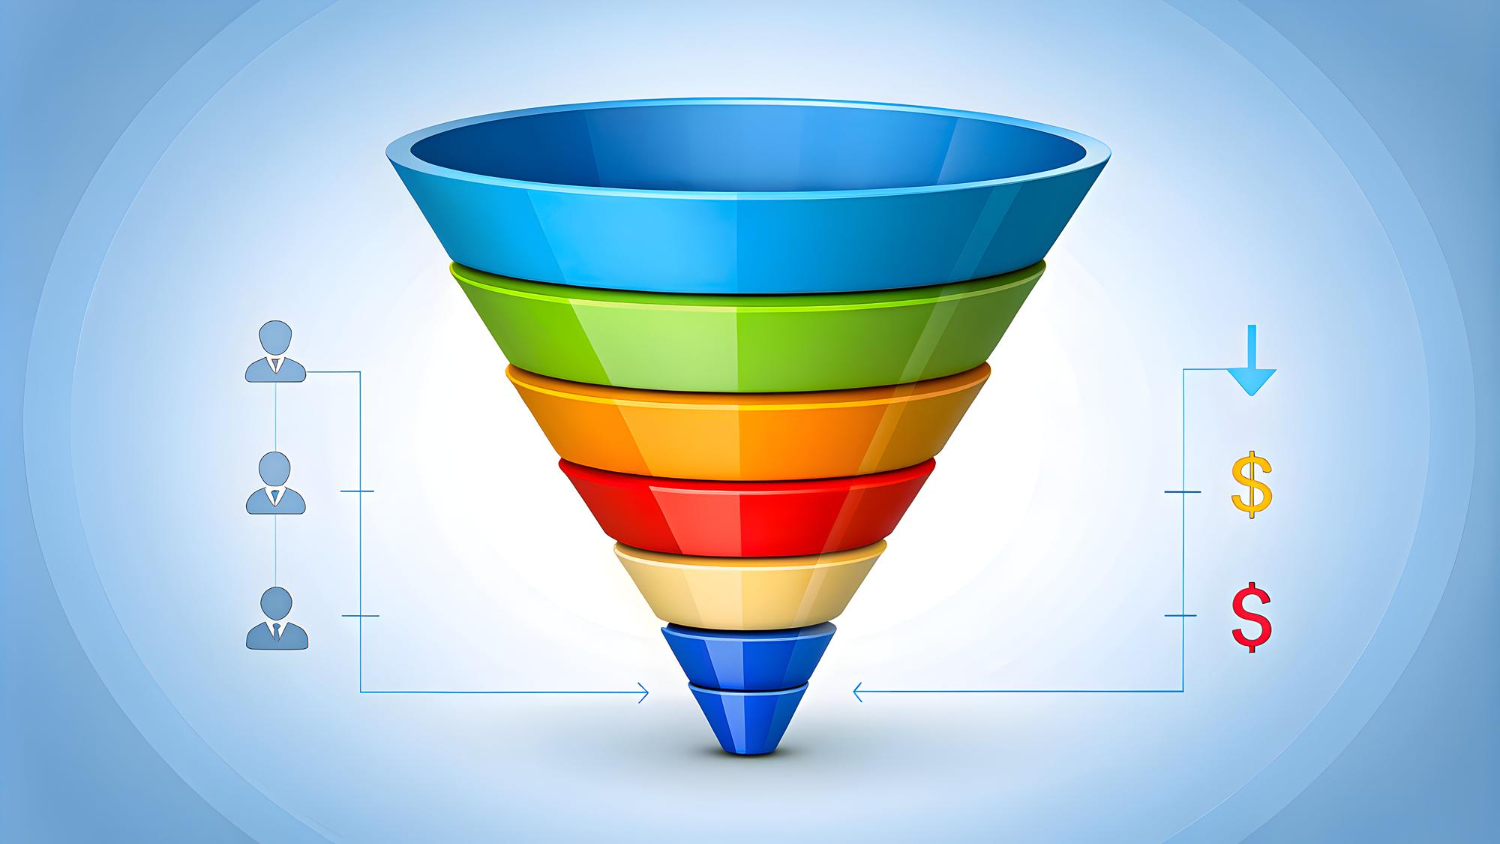
Funnel analysis is the process of mapping and measuring each step a user takes toward a specific goal, then identifying where they leave. Think of it as a diagnostic tool for your conversion path. Instead of just looking at the final outcome (did they buy or not?), you examine every stage in between.
For example, a typical e-commerce funnel might include these steps: landing page visit, product view, add to cart, checkout start, and purchase complete. A SaaS funnel might look different: homepage visit, pricing page, sign-up form, onboarding step one, and activation.
The reason funnel analysis matters is simple. Without it, you are guessing. You might pour money into driving more traffic when the real problem is that 70% of users abandon at checkout. Alternatively, you might redesign your landing page while the actual bottleneck sits three steps deeper in the flow.
According to the Baymard Institute, the average cart abandonment rate is nearly 70%. That is a massive leak. But without proper funnel analysis, you would not know where in the checkout process users bail — or why.
Furthermore, funnel analysis connects directly to micro conversions. Each step in your funnel is essentially a micro conversion. When you track those small wins, you gain visibility into the full journey — not just the endpoint.
Building a Funnel That Reflects Reality
Here is where most teams go wrong from the start. They build their funnel based on how they designed the user flow, not on how users actually behave. In my experience, the gap between those two things is often enormous.
So how do you build a funnel that reflects reality? Start by looking at your data before you define your steps. Look at the most common paths users take. You might discover that a significant portion of users skip your pricing page entirely and go straight to sign-up. If that is the case, including the pricing page as a required funnel step will skew your numbers.
Here are some practical guidelines I follow when building funnels:
- Keep it to 4-6 steps. More than that, and you are tracking noise rather than signal.
- Define each step with a specific event or URL. Vague steps like “engaged with content” are useless for diagnosis.
- Use time windows. A user who visits your site today and converts 30 days later is a different story than one who converts in the same session.
- Segment from the start. Mobile users, desktop users, paid traffic, organic traffic — they all have different funnels.
- Validate with real user paths. After building your funnel, check whether actual user journeys match the steps you defined.
Additionally, consider building multiple funnels for different user segments. As I discussed in my piece on cohort analysis, different groups of users behave in fundamentally different ways. A one-size-fits-all funnel often hides the most important insights.

Where Users Actually Drop Off
After years of analyzing funnels across dozens of sites, I have noticed some consistent patterns. While every business is different, certain drop-off points come up again and again. Let me share the most common ones.
The table below shows typical drop-off rates I have observed across various projects. These are averages, so your numbers may vary. However, they give you a solid benchmark.
| Funnel Stage | Typical Drop-Off Rate | Common Cause | Quick Fix |
|---|---|---|---|
| Landing page to product/feature page | 40-60% | Weak value proposition or slow load time | Improve headline clarity and page speed |
| Product page to add-to-cart / sign-up | 30-50% | Unclear pricing, missing trust signals | Add social proof and transparent pricing |
| Add-to-cart to checkout start | 25-40% | Unexpected costs (shipping, taxes) | Show total cost earlier in the flow |
| Checkout start to payment | 20-35% | Too many form fields, forced account creation | Offer guest checkout, reduce fields |
| Payment to confirmation | 5-15% | Payment errors, limited payment options | Add more payment methods, fix error handling |
What surprises most people is that the biggest drop-off rarely happens at the final step. Instead, the top of the funnel tends to leak the most. That first transition — from landing page to the next meaningful action — is where you lose the most users. Consequently, many teams over-invest in checkout optimization while ignoring the massive losses happening earlier.
Moreover, the drop-off between “add to cart” and “checkout start” is often underestimated. Users add items out of curiosity or for comparison. They treat the cart as a wishlist. As a result, that step frequently has a higher abandonment rate than teams expect.
I wrote extensively about this pattern in my article on form abandonment. The principles are the same: reduce friction, set clear expectations, and make each step feel like progress rather than effort.
Funnel Analysis for E-Commerce vs SaaS
One of the questions I get asked most often is whether funnel analysis works the same way for different business models. The short answer is no. E-commerce funnels and SaaS funnels have fundamentally different structures, timelines, and success metrics.
Let me break down the key differences in the table below.
| Dimension | E-Commerce Funnel | SaaS Funnel |
|---|---|---|
| Primary goal | Completed purchase | Activation or paid subscription |
| Typical length | 4-5 steps | 5-7 steps |
| Time to convert | Minutes to hours | Days to weeks |
| Key drop-off point | Cart to checkout | Sign-up to activation |
| Repeat behavior | Multiple purchases over time | Monthly retention and expansion |
| Revenue model | Transaction-based | Subscription-based (MRR) |
| Biggest optimization lever | Reducing checkout friction | Improving onboarding completion |
For e-commerce, funnel analysis tends to focus on single-session behavior. Users browse, add items, and either buy or leave. The funnel is relatively compact, and improvements often come from reducing friction at specific steps.
In contrast, SaaS funnels stretch across multiple sessions and sometimes multiple weeks. A user might sign up on day one but not reach the “activation” moment until day seven. Therefore, your funnel analysis tool needs to handle cross-session tracking. Otherwise, you are only seeing part of the picture.
Furthermore, SaaS funnels have a critical step that e-commerce funnels lack: activation. This is the moment when a user experiences the core value of your product for the first time. According to Reforge, improving activation rates is one of the highest-leverage growth strategies for SaaS companies. Yet many teams do not even include activation as a defined funnel step.
Common Funnel Analysis Mistakes
Over the years, I have seen teams make the same funnel analysis mistakes repeatedly. Here are the ones that cause the most damage — and how to avoid them.
1. Making the funnel too long. If your funnel has ten steps, you are not analyzing a funnel — you are tracking a user journey. A good funnel should have four to six clearly defined stages. Anything more becomes difficult to act on.
2. Ignoring mobile vs desktop differences. Mobile users behave differently. Their funnels are shorter, their patience is lower, and their drop-off patterns are distinct. Always segment your funnel by device type. In many cases, you will find that mobile has a completely different bottleneck than desktop.
3. Only looking at aggregate numbers. An overall 3% conversion rate tells you almost nothing. You need to break that number down by traffic source, user segment, and time period. Aggregate numbers hide the stories that actually matter.
4. Confusing correlation with causation. Just because users who view your FAQ page convert at a higher rate does not mean the FAQ page causes conversions. Those users might simply be more motivated buyers who happen to read the FAQ. Be careful about drawing causal conclusions from funnel data alone.
5. Not accounting for time. As the Nielsen Norman Group points out, user journeys often span multiple sessions. If your funnel only tracks single-session behavior, you will miss users who research on Monday and buy on Friday. Use session stitching or user-level tracking to capture the full picture.
6. Treating the funnel as static. Your funnel should evolve as your product and audience change. What worked six months ago might not reflect current user behavior. Revisit your funnel definition at least quarterly.
Tools for Privacy-Friendly Funnel Tracking
If you care about user privacy — and in 2026, you really should — you need funnel analysis tools that respect consent and minimize data collection. Fortunately, several excellent options exist that do not rely on invasive tracking.
Here are the tools I recommend for privacy-first funnel analysis:
- Plausible Analytics — A lightweight, open-source analytics tool that offers goal-based funnel tracking without cookies. It is fully GDPR-compliant out of the box and incredibly easy to set up.
- Matomo — A comprehensive analytics platform that you can self-host for full data ownership. Its funnel analysis feature is robust and works well for both e-commerce and SaaS use cases.
- Fathom Analytics — Another privacy-focused option that provides simple funnel tracking with no personal data collection. It is a great choice if you want clean, straightforward reporting.
- PostHog — An open-source product analytics suite with powerful funnel analysis. You can self-host it, which means your data never leaves your infrastructure.
Each of these tools allows you to build and analyze funnels without compromising user privacy. Moreover, because they do not rely on third-party cookies, they tend to produce more accurate data. Cookie blockers and browser restrictions do not interfere with their tracking methods.
When choosing a tool, consider your technical capacity. If you can self-host, Matomo and PostHog give you the most control. If you prefer a managed service, Plausible and Fathom are excellent lightweight alternatives.
Bottom Line
Funnel analysis is not about creating a pretty visualization of your conversion path. It is about finding the specific points where users leave and understanding why. The most effective teams I have worked with treat their funnel as a living document — they revisit it regularly, segment it ruthlessly, and act on what it tells them.
Start by building a funnel that reflects how users actually behave, not how you want them to behave. Then focus on the biggest leaks first. In most cases, that means looking at the top of the funnel, not the bottom. And whatever you do, segment your data. The aggregate view almost always hides the most actionable insights.
If you take one thing away from this article, let it be this: a well-built funnel with honest data will tell you more about your business than any dashboard full of vanity metrics ever could.