Conversion Rate Benchmarks: What Counts as Good (and Why Averages Mislead)

Conversion rate benchmarks are the first thing people reach for when they want to know “are we doing okay?” And I get it — a single number to compare yourself against feels reassuring. But here’s the uncomfortable truth I tell every client: most published benchmarks are close to useless for judging your own site. Not because the data is fake, but because averages hide far more than they reveal.
So let me walk you through what the benchmarks actually say, why they mislead, and how to set a target that means something for your site specifically.
What Counts as a “Good” Conversion Rate?
If you want the headline number, here it is: across ecommerce, the average conversion rate lands somewhere around 2.5% to 3.7%, depending on whose data you read. WordStream’s analysis puts ecommerce closer to 2.35%, while other studies report figures above 3%. Meanwhile, the median landing page across all industries sits near 6.6%.
Notice the problem already. Those numbers disagree with each other by a factor of nearly three. That’s not measurement error — it’s a sign that “the average conversion rate” isn’t really one thing at all.
Conversion Rate Benchmarks by Industry
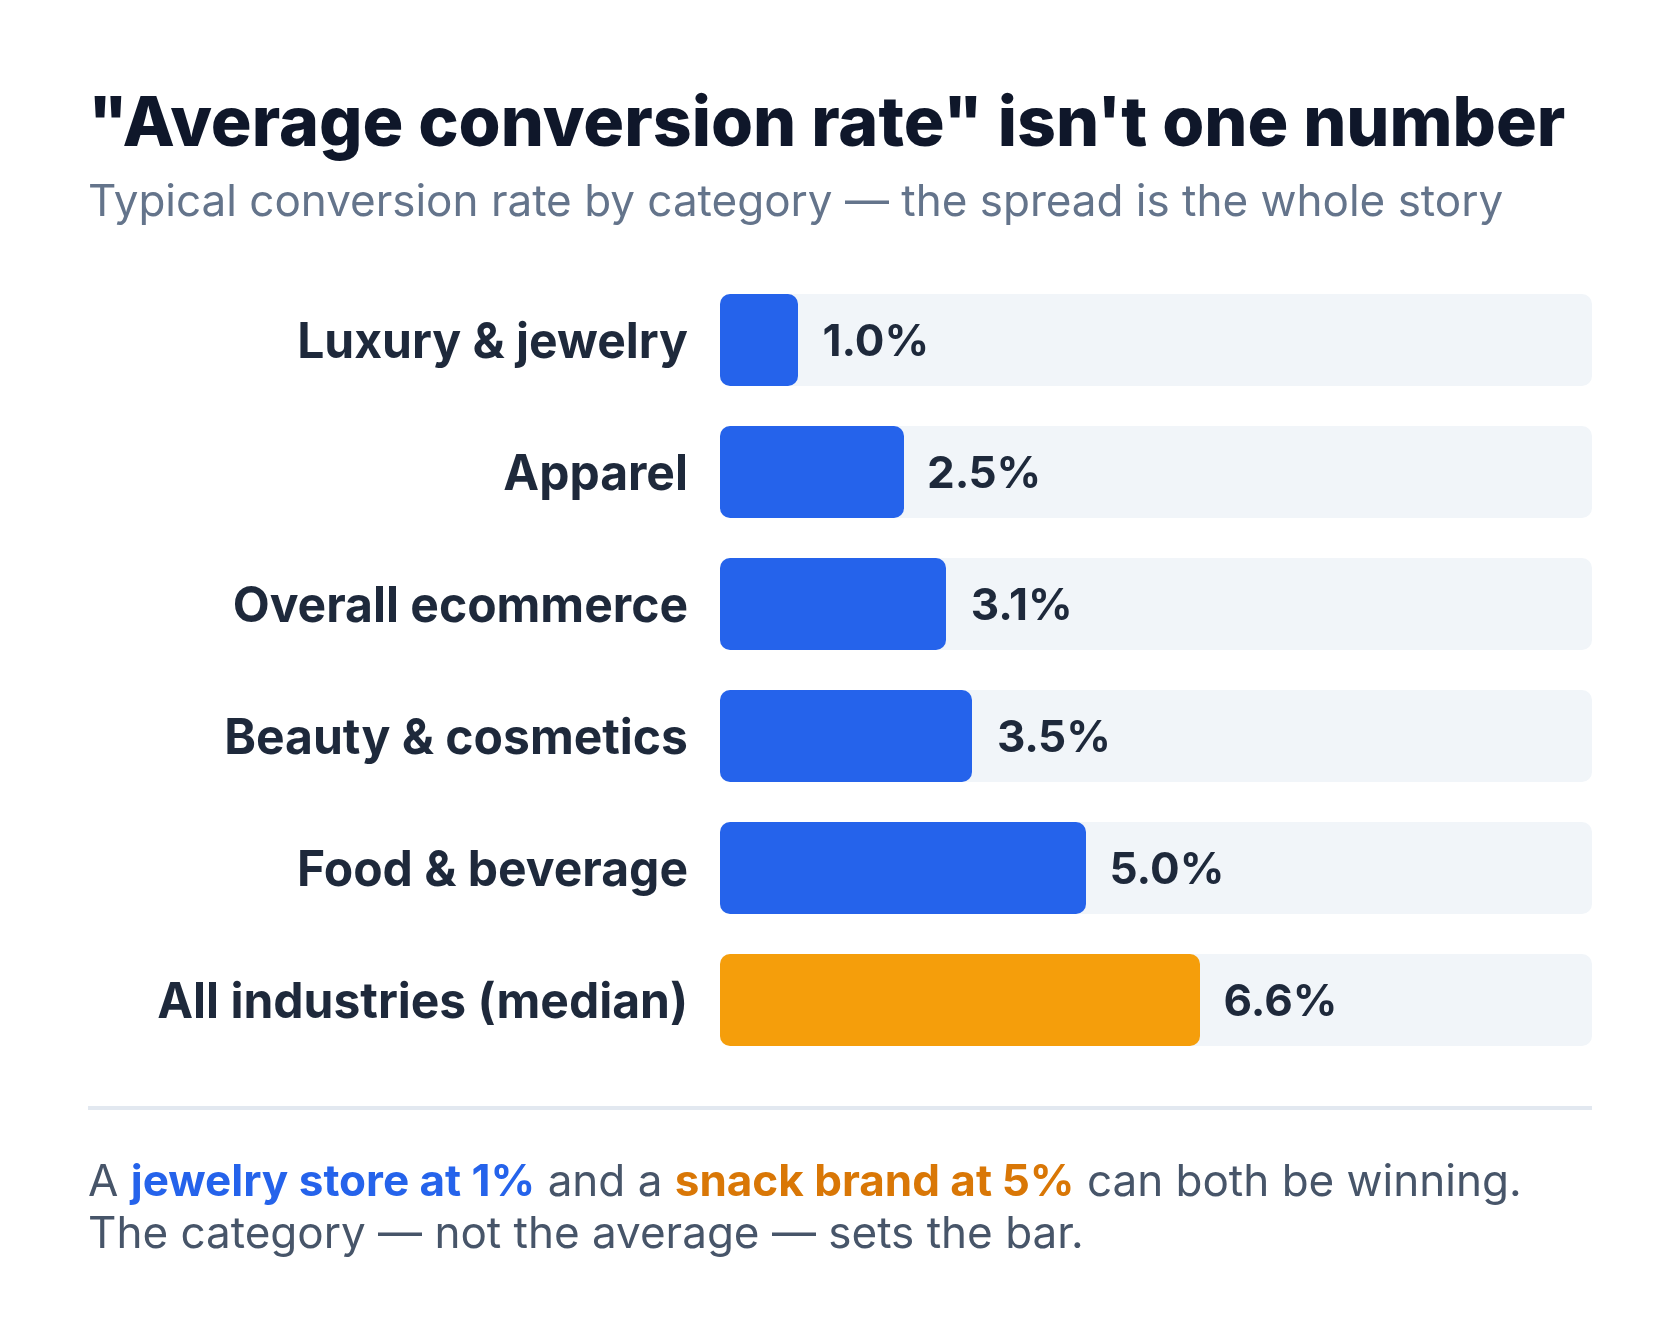
The spread gets wider once you break it down. Here’s a rough picture of where different ecommerce categories tend to land:
| Category | Typical conversion rate |
|---|---|
| Luxury & jewelry | 0.8 – 1.2% |
| Apparel | 2.0 – 3.0% |
| Overall ecommerce | 2.5 – 3.7% |
| Beauty & cosmetics | 3.0 – 4.0% |
| Food & beverage | 4.5 – 6.0% |
| All industries (incl. lead-gen) | ~6.6% median |
A jewelry store converting at 1% and a snack brand converting at 5% can both be doing brilliantly. The products, prices, and buying decisions are simply different. Therefore, comparing a luxury watch site to the “average” tells you nothing useful.
Why Averages Mislead
Three things quietly distort every benchmark you’ll read. Once you see them, you can’t unsee them.
1. The Conversion Definition Changes
This is the big one. A “conversion” might be a completed purchase, a newsletter signup, a free-trial start, or a contact-form submission. Asking someone to buy is a much heavier lift than asking for an email. As a result, lead-generation pages naturally post far higher rates than checkout pages. If a benchmark doesn’t tell you what it counted, it’s noise. For a deeper look at lighter goals, see my piece on micro conversions.
2. Traffic Quality Skews Everything
Two sites with identical products can post wildly different rates based purely on where their visitors come from. Branded and high-intent traffic converts several times better than cold, top-of-funnel traffic. Consequently, a site running brand-name search ads will look like a conversion superstar next to one chasing broad awareness — even if the second site is healthier overall.
3. Averages Hide the Distribution
An “average” of 3% might mean everyone clusters around 3%, or it might mean half the sites convert at 0.5% and a few outliers hit 12%. These are completely different realities, yet they produce the same average. In my experience, the median and the spread matter far more than the mean.
How to Set a Benchmark That Actually Helps
Stop comparing yourself to strangers. Here’s the approach I use instead.
- Benchmark against your own past. Last quarter’s rate, measured the same way, is the only truly fair comparison. Beating yourself is real progress.
- Segment before you judge. Split by traffic source, device, and landing page. A “bad” overall rate is often one weak segment dragging down several strong ones.
- Match the goal to the page. Judge a checkout page against purchase rates and a lead page against signup rates — never against each other.
- Test, don’t guess. When you want to move the number, run a proper experiment. Just make sure you reach statistical significance before you trust the result.
When a client tells me their rate is “below average,” my first question is always: average of what, measured how, for which traffic? Usually the worry evaporates once we segment properly.
Common Mistakes With Conversion Benchmarks
- Chasing a vanity number. A higher conversion rate on worse traffic can mean less revenue. Always tie the rate back to actual outcomes.
- Ignoring abandonment. A “low” rate sometimes hides a fixable leak. My write-up on cart abandonment covers where that revenue goes.
- Treating one month as a trend. Conversion rates bounce around with seasonality and promotions. Look at trends, not snapshots.
Frequently Asked Questions
What is a good conversion rate for a small business?
For ecommerce, anything in the 2–4% range is healthy, and lead-gen pages often run higher. But “good” really means improving on your own previous numbers with the same measurement and traffic mix.
Why is my conversion rate lower than the industry average?
Usually it’s the comparison, not your site. Different conversion definitions, traffic sources, and product types make published averages a poor match. Segment your own data before assuming something is broken.
How often should I check my conversion rate?
Review trends monthly, but make decisions on longer windows. Daily numbers are too noisy to act on, and seasonality can easily fool you over short stretches.
Bottom Line
Conversion rate benchmarks are useful for context and useless as a verdict. The published averages disagree because they measure different goals, different traffic, and different industries — then flatten all of it into a single tidy number. Use the ranges to sanity-check your ballpark, then ignore them and benchmark against your own history, segment by segment. That’s the comparison that tells you whether you’re actually getting better. In my experience, it’s the only one worth acting on.